
In the last couple of weeks disastermappers Heidelberg and GIScience members were interested in finding a way to monitor changes in the OpenStreetMap database. This could help to provide better feedback after mapathons and could allow to measure how many objects like buildings or roads were created or modified during a mapathon.
(It was even possible to spot the decline during the ‘pizza break’ of our mapathons. )
Finally, we can now present a first version of a python based tool. More technical information and the source code can be found here:
https://github.com/Hagellach37/osm_monitoring_tool
This tool has been tested during our second Sokodé mapathon on June 16 in Heidelberg. Overall our motivated GIS students created more than 1,000 buildings. Most of these were created between 7:02pm and 7:41pm. We are also happy that some buildings, that has already been stored in the OpenStreetMap database, were modified and corrected during our mapathon.
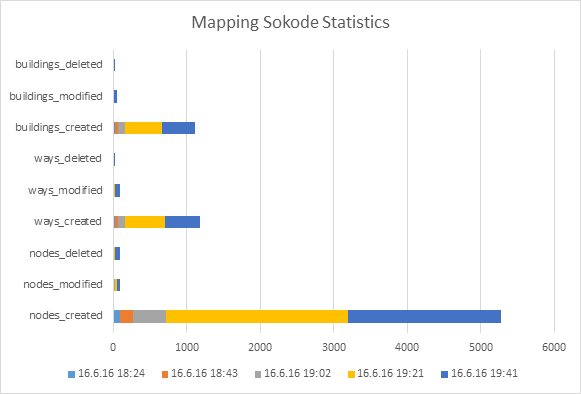
It seems that monitoring the OpenStreetMap database during mapathons can help to motivate volunteers and can help us in the future to better understand where and when problems during the mapping occur.
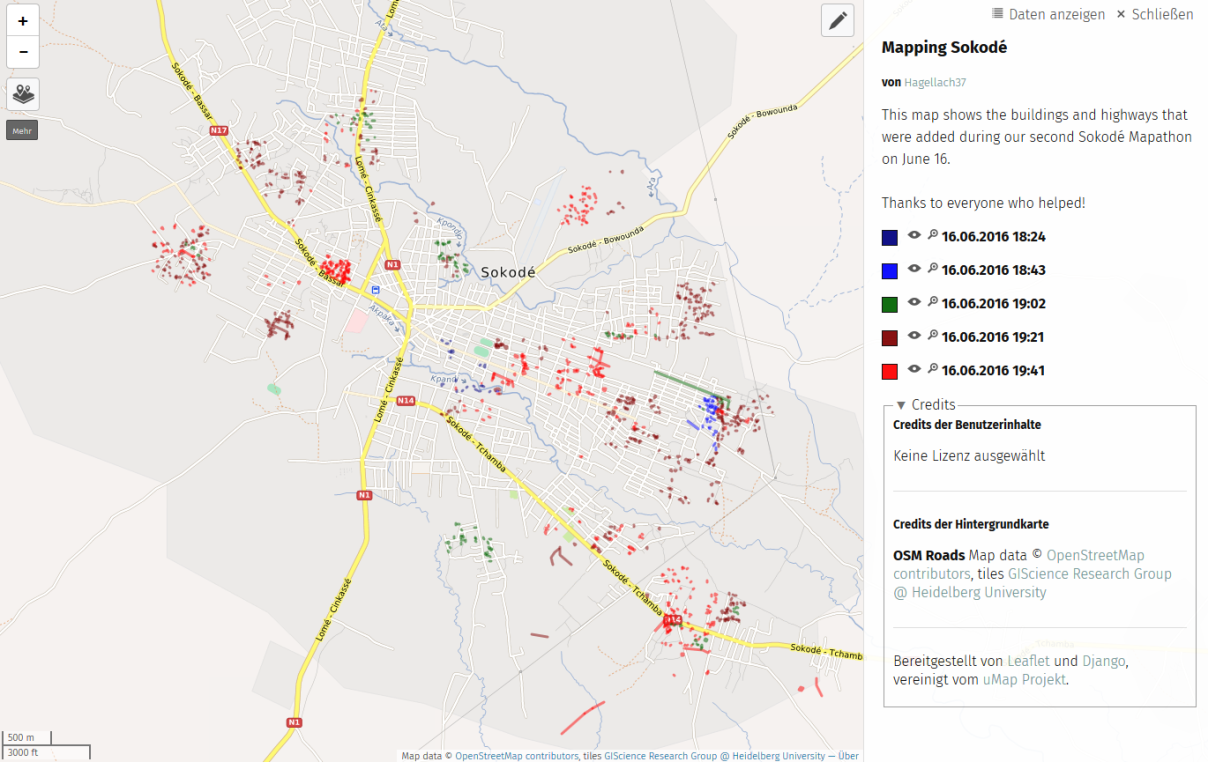
The results of the tool can also be visualized on a webmap immediately at the mapathon. (Open the .osc files in JOSM and then export the data layer as GeoJSON. Then add this as a new layer to uMap.)
If you are interested in using this during your mapathon or have any other related questions feel free to contact us!![]()