• Home
  • About

GIScience News Blog

News of Heidelberg University’s GIScience Research Group.

Feed on
Posts
Comments
« Apartment search with Openrouteservice; a new Python notebook example:
Colloquium on Change Analysis of Hypertemporal Terrestrial Laser Scanning Point Clouds »

The Ohsome API: dynamic OSM statistics for real-world applications

Apr 26th, 2018 by GIScienceHD

The Ohsome API, developed at HeiGIT, is part of the ohsome OSM history analytics platform (and yes, it is pronounced like the word “awesome” ;-).  It serves as the connection between the OpenStreetMap History Database (OSHDB) and possible frontends, such as the Ohsome Nepal Dashboard prototype. The communication with the Ohsome API works via HTTP GET and POST requests as it is based on the Representational State Transfer (REST) principle. This API is programmed in Java using the Spring Boot web-framework. The main reason behind its development is to also allow non-programmers to analyze the rich data source of the OpenStreetMap (OSM) history. It enables one to perform analysis using a dashboard-like application, or use the Ohsome API directly and work with its JSON responses.

Today we want to give a first impression on how the Ohsome API will look like. The best way to explain something is to give a working example. Therefore, you see the following link, which is used to explain the scheme of a GET request to the Ohsome API. It is a first preview using data from Nepal.

https://api.ohsome.org/v0.9/elements/count/groupBy/boundary? bboxes=Kathmandu:85.2,27.6,85.45,27.8|Pokhara:83.9142,28.1693,84.0775,28.2687& types=way&time=2015-01-01/2017-01-01/P1M& keys=building&values=residential&showMetadata=true

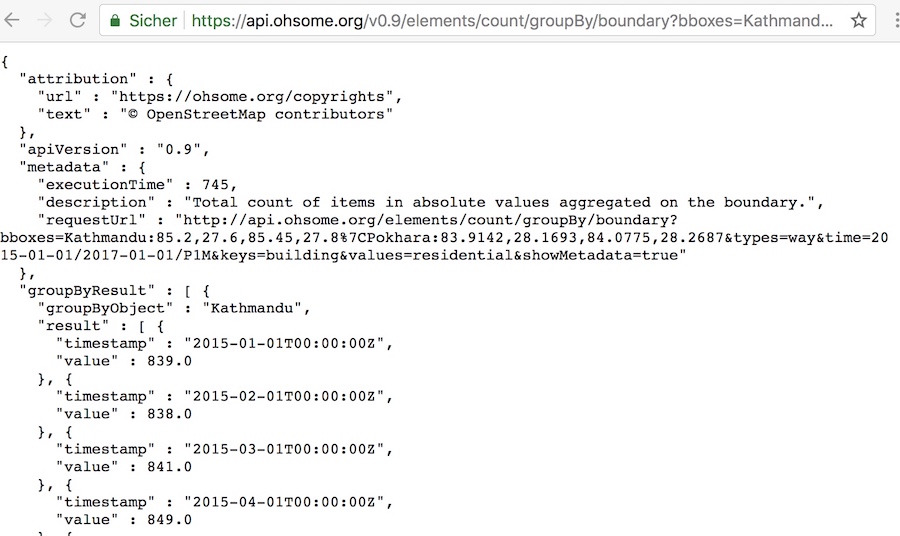
Let’s analyze each component of the URL: The first part consists of the address of the server (”https://api.ohsome.org”) and the version of the API (”/v0.9“).

Next comes the type of object that we want to request (”/elements“). At the moment, “elements” and “users” are available.

After that, the aggregation function (”/count/groupBy/boundary“) follows. In this case, we use a count function to compute the number of elements, which get grouped by the boundary (=spatial) parameter. Other possible aggregation functions would be “length“, “perimeter“, or “area“. For grouping the result, all filters can be used.

The remaining parts of the URL are parameters for filtering the data. The first one is a spatial filter (”bboxes=Kathmandu:85.2,27.6,85.45,27.8|Pokhara:83.9142,28.1693,84.0775,28.2687“). We use two bounding boxes around the two largest cities of Nepal: Kathmandu and Pokhara. As their names are included in the bboxes parameter of the request, they will also be used in the response to be able to assign the results to their proper region. Other possible spatial filters would be “bcircles“, which are points with a corresponding radius and “bpolys“, which are polygons. The “bpolys” parameter can also process GeoJSON as input.

The next part (”types=way“) refers to the OSM-type. This parameter can include “node” and/or “way” and/or “relation“.

The temporal filter (”time=2015-01-01/2017-01-01/P1M“) defines a time period of two years, in which results in a monthly interval (”P1M“) are computed. The time parameter can consist of a timestamp, a time span (with intervals), or a list of timestamps.

Through the parameters “keys” and “values“, you can filter on the OSM-tags (”keys=building&values=residential“).

The last parameter (”showMetadata=true“) enables the inclusion of metadata information like the computation time, or a description of the results in the response.

The current implementation of the Ohsome API combines all parameters through an “and-combination“. With having a more powerful filter system, one could request something like “Give me the length of streets that have a maxspeed of 30 OR a maxspeed of 50 AND have no name“. Going to the direction of a query language would enable further flexibility in the data-request. You can contact us at info@heigit.org if you want to give us feedback. Stay tuned for further updates!

The work at HeiGIT is kindly supported by the Klaus Tschira Foundation, Heidelberg.
ohsome.org

Tags: Big Spatial Data, data quality, heigit, ohsome, ohsome example, OSM, OSM History Analytics

Posted in OSM, Services, Software

Comments are closed.

  • About

    GIScience News Blog
    News of Heidelberg University’s GIScience Research Group.
    There are 1,461 Posts and 0 Comments so far.

  • Meta

    • Log in
    • Entries RSS
    • Comments RSS
    • WordPress.org
  • Recent Posts

    • Find the route to your nearest Covid-19 vaccination center in Germany — new App by HeiGIT based on OpenStreetMap and openrouteservice
    • ohsome street network analysis part 1
    • Keynote at McGILL GIS DAY: Analysing and Improving OpenStreetMap for Humanitarian Aid with Data Mining and GeoAI
    • Update on “Accessibility of COVID-19 vaccination centers in Germany”
    • Globales Gletschermonitoring - Chance und Herausforderung — HGG Vortrag am 19.Januar 2021 Dr. Isabelle Gärtner-Roer, World Glacier Monitoring Service, Universität Zürich
  • Tags

    3D 3DGEO Big Spatial Data CAP4Access Citizen Science Colloquium crisis mapping Crowdsourcing data quality disaster DisasterMapping GeoNet.MRN GIScience heigit HOT humanitarian Humanitarian OpenStreetMap team intrinsic quality analysis landuse laser scanning Lidar Mapathon MapSwipe Missing Maps MissingMaps ohsome ohsome example Open data openrouteservice OpenStreetMap OSM OSM History Analytics OSMlanduse Quality quality analysis remote sensing routing social media spatial analysis Teaching terrestrial laser scanning Twitter VGI Wheelchair Navigation Workshop
  • Archives

    • January 2021
    • December 2020
    • November 2020
    • October 2020
    • September 2020
    • August 2020
    • July 2020
    • June 2020
    • May 2020
    • April 2020
    • March 2020
    • February 2020
    • January 2020
    • December 2019
    • November 2019
    • October 2019
    • September 2019
    • August 2019
    • July 2019
    • June 2019
    • May 2019
    • April 2019
    • March 2019
    • February 2019
    • January 2019
    • December 2018
    • November 2018
    • October 2018
    • September 2018
    • August 2018
    • July 2018
    • June 2018
    • May 2018
    • April 2018
    • March 2018
    • February 2018
    • January 2018
    • December 2017
    • November 2017
    • October 2017
    • September 2017
    • August 2017
    • July 2017
    • June 2017
    • May 2017
    • April 2017
    • March 2017
    • February 2017
    • January 2017
    • December 2016
    • November 2016
    • October 2016
    • September 2016
    • August 2016
    • July 2016
    • June 2016
    • May 2016
    • April 2016
    • March 2016
    • February 2016
    • January 2016
    • December 2015
    • November 2015
    • October 2015
    • September 2015
    • August 2015
    • July 2015
    • June 2015
    • May 2015
    • April 2015
    • March 2015
    • February 2015
    • January 2015
    • December 2014
    • November 2014
    • October 2014
    • September 2014
    • August 2014
    • July 2014
    • June 2014
    • May 2014
    • April 2014
    • March 2014
    • February 2014
    • January 2014
    • December 2013
    • November 2013
    • October 2013
    • September 2013
    • August 2013
    • July 2013
    • June 2013
    • May 2013
    • April 2013
  •  

    April 2018
    M T W T F S S
    « Mar   May »
     1
    2345678
    9101112131415
    16171819202122
    23242526272829
    30  
  • Recent Comments

    GIScience News Blog CC by-nc-sa Some Rights Reserved.

    Free WordPress Themes | Fresh WordPress Themes