• Home
  • About

GIScience News Blog

News of Heidelberg University’s GIScience Research Group.

Feed on
Posts
Comments
« Neues mFUND Project: Temporal Access Restrictions for Dynamic Ultra-Flexible Routing - TARDUR
openrouteservice Io »

Global analyses are ohsome

Mar 13th, 2019 by Fabian Kowatsch

We, the Big Spatial Data Analytics Group at HeiGIT have ohsome news to share: From now on, you can send your requests to our global ohsome API instance. So far, we’ve had a public instance for Nepal and Germany, but now you can analyse OSM’s history globally.

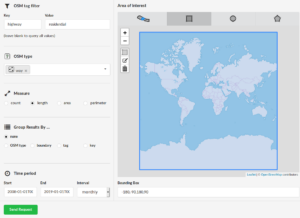
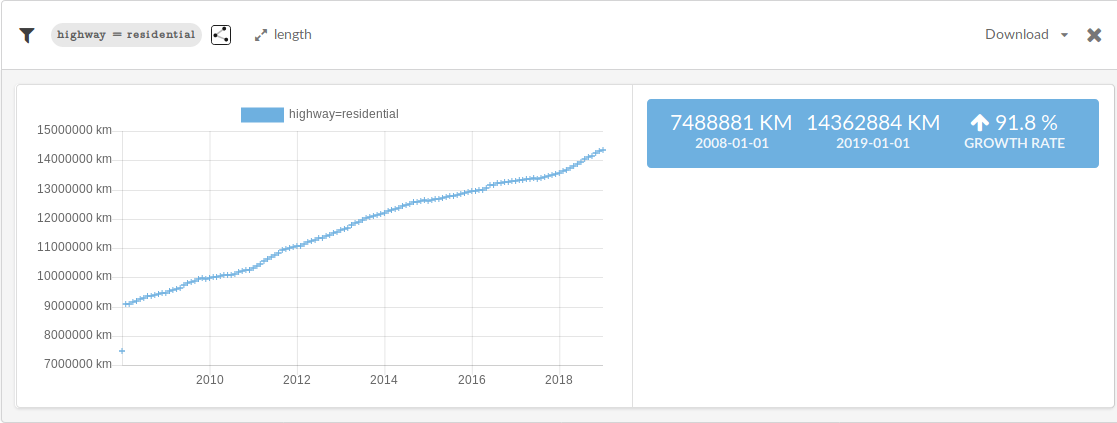
Additionally to the API, we also have a global dashboard instance. You choose any country, or region (or everything) select your measure of choice (count, length, area, perimeter), a time period and your grouping mode of choice (type, boundary, tag, key). Then you can fire your request against the underlying global ohsome API. This blog post gives you a bit more information on the usage of the dashboard. The following screenshot shows a global request in the dashboard, where the length of roads having the highway=residential tag is computed in a time span of 11 years for a monthly interval. It takes less than a minute to compute the result and display the diagram.

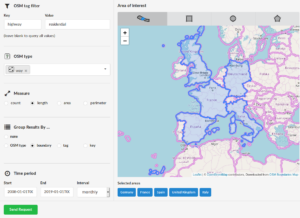
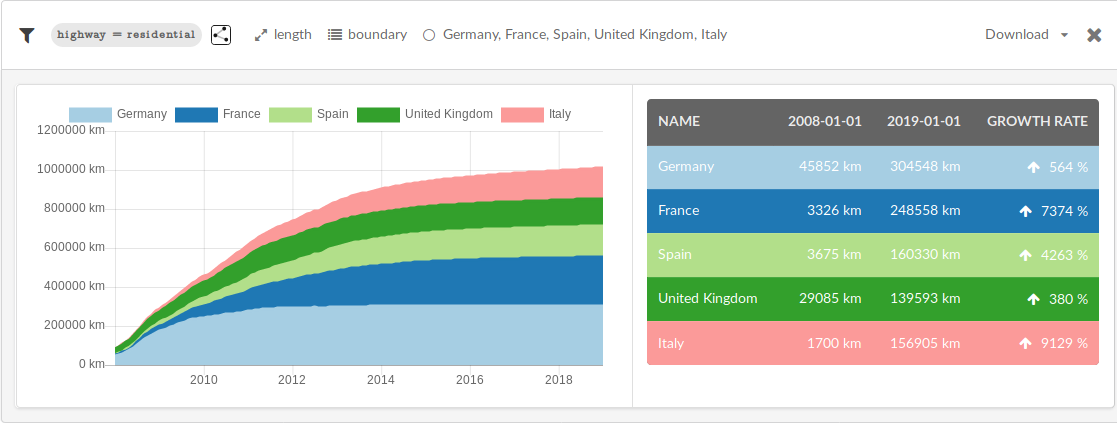
Another example uses a newly implemented feature, where results are grouped by the selected boundaries, in this example five countries in Europe. It uses the same measure (length), key, value and time parameters.

You want to visualize the development of your region? Look at the attributive completeness of two regions of your choice? Compare the tag usage of city-x in Africa with city-y in South-America? Just ask our global ohsome API instance these questions using the respective resources and parameters and it will be happy to provide you with the requested data. And it will do that for any region on the world, because you know, global analysis are (see title). And because they are awesome too, we’ve recently had a revival of a former project that generates global maps, now also via using the ohsome framework. Check out ohsomeHeX for an early preview for a first set of selected tags.
For further inquiries, feedback, etc. we are reachable under info@heigit.org. Stay ohsome!

Tags: Big Spatial Data, heigit, intrinsic quality analysis, ohsome, ohsome example, oshdb, OSM, OSM History Analytics

Posted in OSM, Services, Software, VGI Group

Comments are closed.

  • About

    GIScience News Blog
    News of Heidelberg University’s GIScience Research Group.
    There are 1,679 Posts and 0 Comments so far.

  • Meta

    • Log in
    • Entries RSS
    • Comments RSS
    • WordPress.org
  • Recent Posts

    • High Resolution Data Insights from OpenStreetMap Element Vectorisation
    • Data publication: Point clouds of snow-on and snow-off forest site
    • Job Offer: Deep Learning Engineer (m/f/d, up to 100%)
    • GIScience Postdoc/Senior Researcher Opportunity for OpenStreetMap Road Quality Analysis
    • Assessing road criticality and loss of healthcare accessibility during floods: the case of Cyclone Idai, Mozambique 2019
  • Tags

    3D 3DGEO Big Spatial Data CAP4Access Citizen Science Conference crisis mapping Crowdsourcing data quality deep learning disaster DisasterMapping GeoNet.MRN GIScience heigit HOT humanitarian humanitarian mapping Humanitarian OpenStreetMap team intrinsic quality analysis landuse laser scanning Lidar machine-learning Mapathon MapSwipe MissingMaps Missing Maps ohsome ohsome example Open data openrouteservice OpenStreetMap OSM OSM History Analytics Public Health Quality quality analysis remote sensing routing social media spatial analysis Teaching VGI Workshop
  • Archives

    • February 2023
    • January 2023
    • December 2022
    • November 2022
    • October 2022
    • September 2022
    • August 2022
    • July 2022
    • June 2022
    • May 2022
    • April 2022
    • March 2022
    • February 2022
    • January 2022
    • December 2021
    • November 2021
    • October 2021
    • September 2021
    • August 2021
    • July 2021
    • June 2021
    • May 2021
    • April 2021
    • March 2021
    • February 2021
    • January 2021
    • December 2020
    • November 2020
    • October 2020
    • September 2020
    • August 2020
    • July 2020
    • June 2020
    • May 2020
    • April 2020
    • March 2020
    • February 2020
    • January 2020
    • December 2019
    • November 2019
    • October 2019
    • September 2019
    • August 2019
    • July 2019
    • June 2019
    • May 2019
    • April 2019
    • March 2019
    • February 2019
    • January 2019
    • December 2018
    • November 2018
    • October 2018
    • September 2018
    • August 2018
    • July 2018
    • June 2018
    • May 2018
    • April 2018
    • March 2018
    • February 2018
    • January 2018
    • December 2017
    • November 2017
    • October 2017
    • September 2017
    • August 2017
    • July 2017
    • June 2017
    • May 2017
    • April 2017
    • March 2017
    • February 2017
    • January 2017
    • December 2016
    • November 2016
    • October 2016
    • September 2016
    • August 2016
    • July 2016
    • June 2016
    • May 2016
    • April 2016
    • March 2016
    • February 2016
    • January 2016
    • December 2015
    • November 2015
    • October 2015
    • September 2015
    • August 2015
    • July 2015
    • June 2015
    • May 2015
    • April 2015
    • March 2015
    • February 2015
    • January 2015
    • December 2014
    • November 2014
    • October 2014
    • September 2014
    • August 2014
    • July 2014
    • June 2014
    • May 2014
    • April 2014
    • March 2014
    • February 2014
    • January 2014
    • December 2013
    • November 2013
    • October 2013
    • September 2013
    • August 2013
    • July 2013
    • June 2013
    • May 2013
    • April 2013
  •  

    March 2019
    M T W T F S S
    « Feb   Apr »
     123
    45678910
    11121314151617
    18192021222324
    25262728293031
  • Recent Comments

    GIScience News Blog CC by-nc-sa Some Rights Reserved.

    Free WordPress Themes | Fresh WordPress Themes